Confusion Matrix#
Guide: True Positive / False Positive / False Negative / True Negative
You can find more info on true positive, false positive, false negative, and true negative in the TP / FP / FN / TN guide.
A confusion matrix is a structured plot describing classification model performance as a table that highlights counts of objects with predicted classes (columns) against the actual classes (rows). Each cell has a count of the number of objects that have its correct class and predicted class, which indicates how confused a model is. A model is confused when a predicted class does not match the actual class. When they do match, this is considered a true positive (TP). In general, a model resulting in more true positives (TPs) / true negatives (TNs) with fewer false positives (FPs) / false negatives (FNs) is better.
Confusion matrices are used in classification workflows with only one class or with multiple classes, which extends to object detection workflows, too. They help evaluate models by counting classification errors and visualizing class imbalances.
-
API Reference:
ConfusionMatrix↗
Implementation Details#
The implementation of a confusion matrix depends on whether the workflow concerns one or more classes.
Single-Class#
Single-class confusion matrices are used for binary classification problems. After computing the number of TPs, FPs, FNs, and TNs, a confusion matrix would look like this:
| Predicted Positive | Predicted Negative | |
|---|---|---|
| Actual Positive | True Positive (TP) | False Negative (FN) |
| Actual Negative | False Positive (FP) | True Negative (TN) |
Example: Single-Class#
Let's consider a simple binary classification example and plot a confusion matrix. The table below shows five samples' (three positive and two negative) ground truth labels and inference labels.
| Sample 1 | Sample 2 | Sample 3 | Sample 4 | Sample 5 | |
|---|---|---|---|---|---|
| Ground Truth | Cat |
Cat |
Cat |
No Cat |
No Cat |
| Inference | Cat |
No Cat |
No Cat |
No Cat |
Cat |
A confusion matrix for this example can be plotted:
Predicted Cat |
Predicted No Cat |
|
|---|---|---|
Cat |
1 | 2 |
No Cat |
1 | 1 |
Multiclass#
Multiclass confusion matrices, used for multiclass classification problems, outline counts of TPs, FPs, FNs, and TNs for every unique pair of actual and predicted labels. A multiclass classification confusion matrix with three classes would have the following format:
Predicted Airplane |
Predicted Boat |
Predicted Car |
|
|---|---|---|---|
Actual Airplane |
Correct Prediction | Incorrect Prediction | Incorrect Prediction |
Actual Boat |
Incorrect Prediction | Correct Prediction | Incorrect Prediction |
Actual Car |
Incorrect Prediction | Incorrect Prediction | Correct Prediction |
And for example, if we are trying to calculate the counts of TP, FP, FN, and TN for class Boat:
Predicted Airplane |
Predicted Boat |
Predicted Car |
|
|---|---|---|---|
Actual Airplane |
True Negative | False Positive | True Negative |
Actual Boat |
False Negative | True Positive | False Negative |
Actual Car |
True Negative | False Positive | True Negative |
Example: Multiclass
Let's take a look at a multiclass classification example and plot a confusion matrix. In this example, we have three
classes: Airplane, Boat, and Car. The multiclass classifier outputs the following inferences:
| Sample 1 | Sample 2 | Sample 3 | Sample 4 | Sample 5 | Sample 6 | |
|---|---|---|---|---|---|---|
| Ground Truth | Airplane |
Boat |
Car |
Airplane |
Boat |
Boat |
| Inference | Airplane |
Boat |
Airplane |
Airplane |
Boat |
Car |
A confusion matrix for this example can be plotted:
Predicted Airplane |
Predicted Boat |
Predicted Car |
|
|---|---|---|---|
Airplane |
2 | 0 | 0 |
Boat |
0 | 2 | 1 |
Car |
1 | 0 | 0 |
In a different case, these counts may be much higher:
Predicted Airplane |
Predicted Boat |
Predicted Car |
|
|---|---|---|---|
Airplane |
200 | 0 | 0 |
Boat |
100 | 8,800 | 600 |
Car |
100 | 0 | 1,000 |
This confusion matrix reveals that a model is very good at identifying the Boat class: 8,800 of 9,500 Boats were correctly
predicted. Of the 700 incorrect Boat predictions, 600 were predicted as Car, and 100 were predicted as Airplane.
This confusion matrix indicates that when a model makes a Airplane inference, the model is correct half the time. If
it is incorrect, it has labeled the Airplane as a Boat or a Car.
Whenever there is an actual Airplane class, the model never predicts that there is a different transportation object.
Normalization#
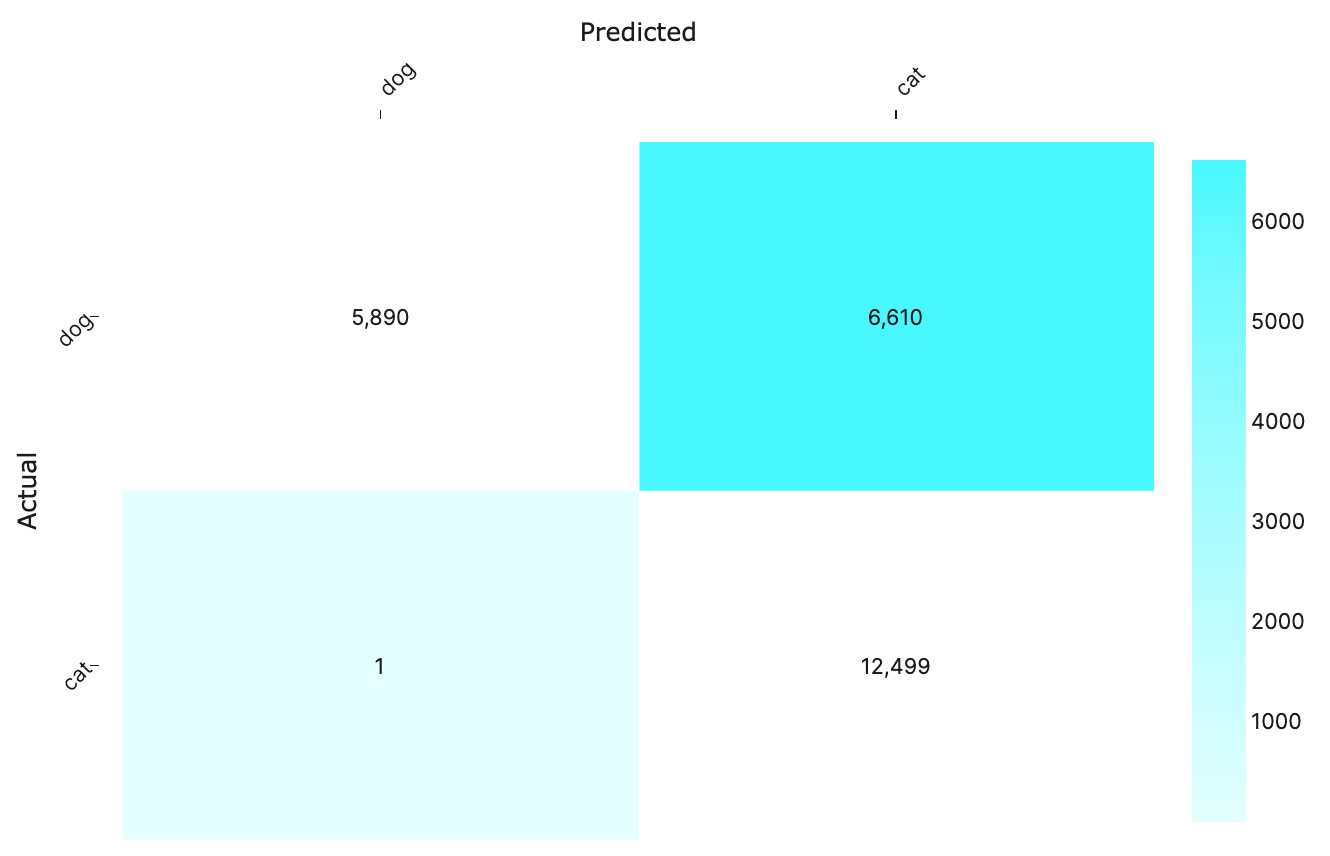
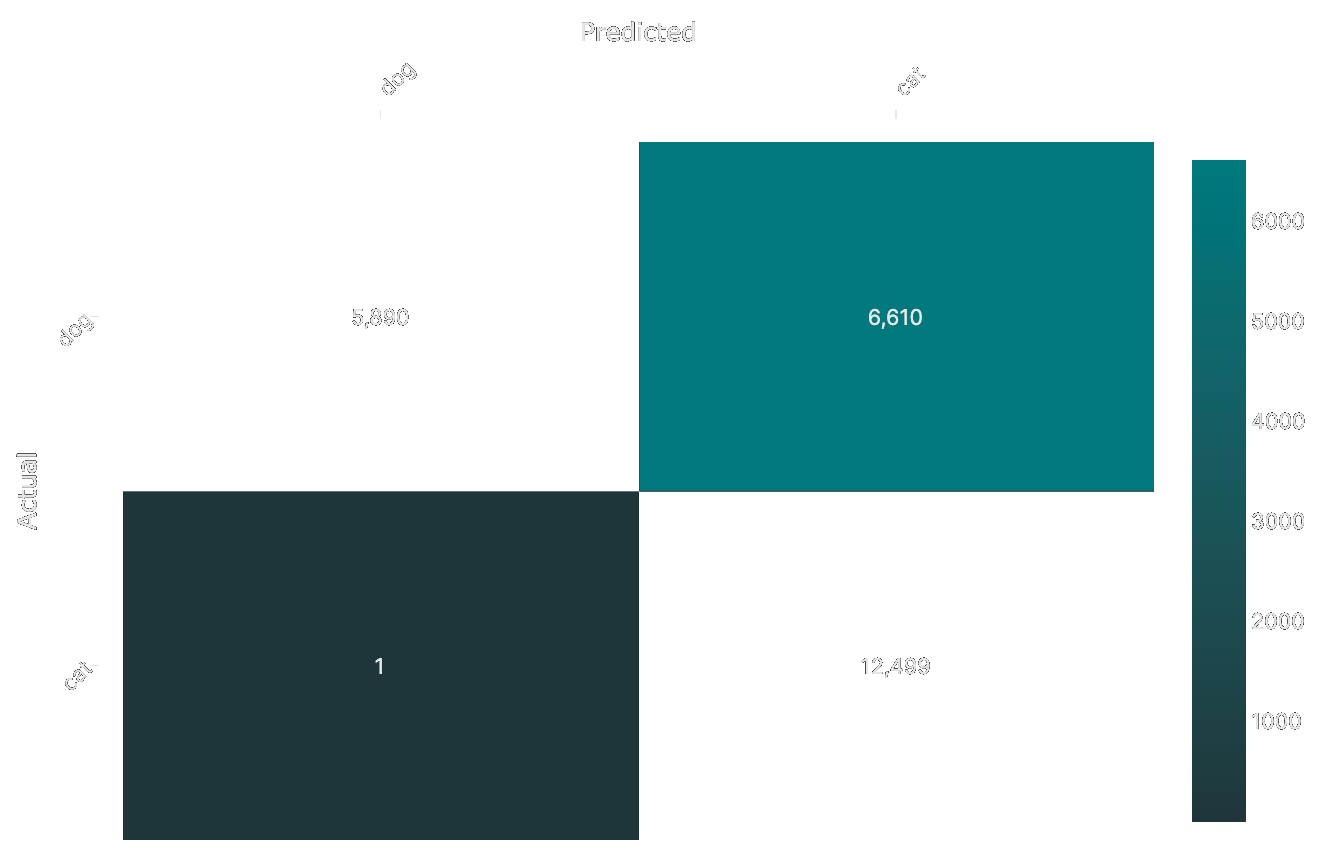
Sometimes it is easier to focus on class-level behavior if you are using a normalized confusion matrix. If confusion matrices are color-coded, normalizing can also create a better visual representation:

You can normalize a confusion matrix by row (actual classes), column (predicted classes), or all (entire matrix).
Each type of normalization surfaces a view sharing different information, which is outlined below.
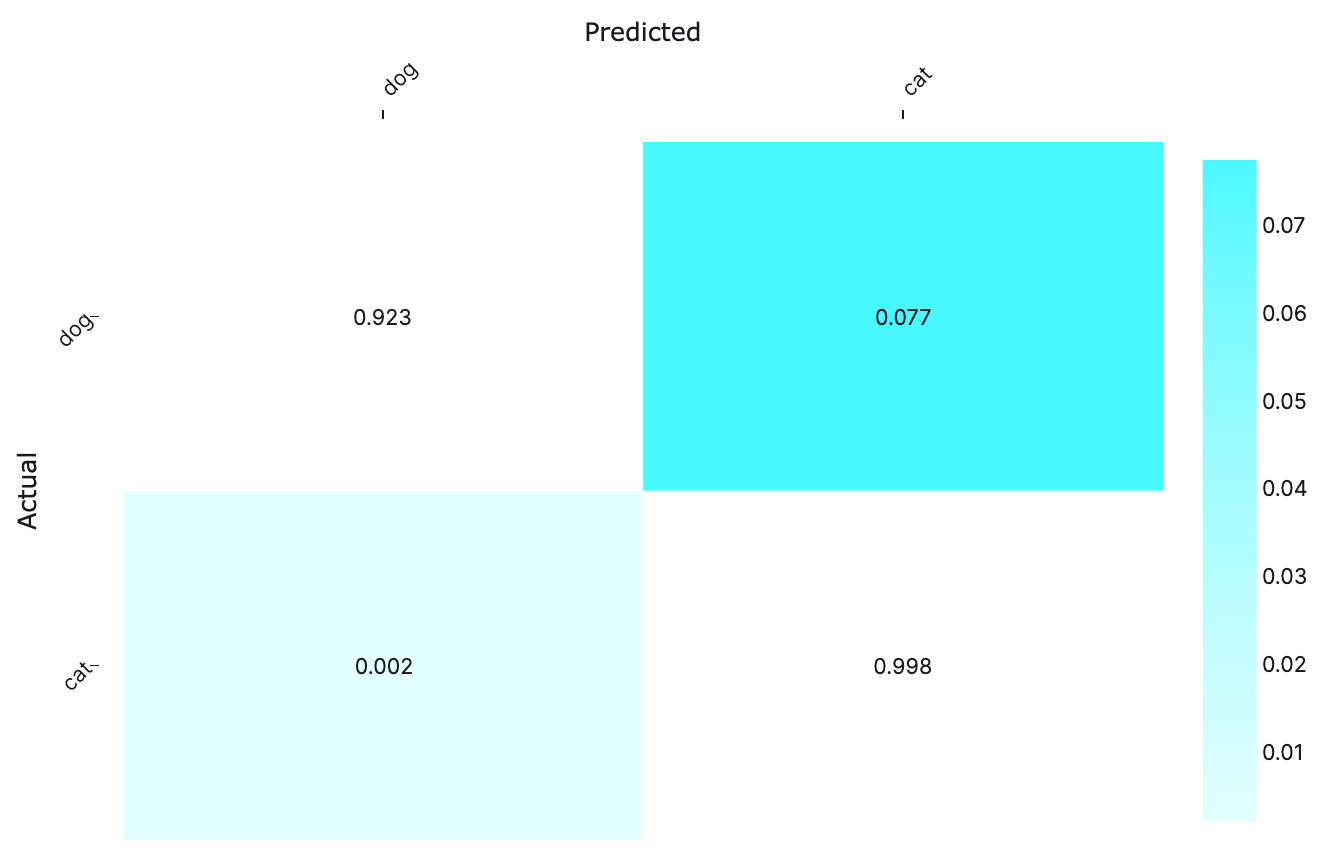
Normalizing by row
For an actual class, this normalization allows us to see the proportion of correctly or incorrectly predicted
objects for each predicted class. Notice that the diagonal values from this normalization match the
recall per class. To normalize by row, divide each entry in that row by the sum of values within
it. If we normalize the multiclass example by row, we get:
Predicted Airplane |
Predicted Boat |
Predicted Car |
|
|---|---|---|---|
Airplane |
1 | 0 | 0 |
Boat |
0.01 | 0.93 | 0.06 |
Car |
0.09 | 0 | 0.91 |
Normalizing by column
For a predicted class, this normalization allows us to see the proportion of instances predicted as a certain class
that actually belong to each true class. Notice that the diagonal values from this normalization match the
precision per class. To normalize by column, divide each entry in a column by the sum of
values within that column. If we normalize the multiclass example by column, we get:
Predicted Airplane |
Predicted Boat |
Predicted Car |
|
|---|---|---|---|
Airplane |
0.5 | 0 | 0 |
Boat |
0.25 | 1 | 0.375 |
Car |
0.25 | 0 | 0.625 |
Normalizing by all
For each entry, this normalization allows us to see the overall proportion of instances that fall into a combination
of an actual and predicted class. To normalize by all, divide each entry by the total sum of all the values in
the matrix. If we normalize the multiclass example by all, we get:
Predicted Airplane |
Predicted Boat |
Predicted Car |
|
|---|---|---|---|
Airplane |
0.02 | 0 | 0 |
Boat |
0.01 | 0.81 | 0.06 |
Car |
0.01 | 0 | 0.09 |
Limitations and Biases#
Confusion matrices are great for the evaluation of models that deal with multiple classes. They are structured tables of numbers, which is its strength and weakness.
- Class imbalance: Confusion matrices can appear biased when dealing with imbalanced numbers of instances per class, leading to skewed numbers. This can be addressed by normalizing the matrix.
- Categorical evaluation: Confusion matrices have categorical outputs and do not surface any details for misclassifications. All misclassifications are treated equally, so there may be cases where classes are similar or hierarchically related, but confusion matrices will not account for these details.