Classification#
Experimental Feature
This pre-built workflow is an experimental feature. Experimental features are under active development and may occasionally undergo API-breaking changes.
Classification is a machine learning task aiming to group objects and ideas into preset categories. Classification models used in machine learning predict the likelihood or probability that the data will fall into one of the predetermined categories.
There are different types of classification models:
| Classification Type | Description |
|---|---|
| Binary | Classification model predicts a single class, using a threshold on prediction confidence to bisect the test set |
| Multiclass | Classification model predicts a single class from more than two classes, with highest prediction confidence |
| Multi-label | Classification model predicts multiple classes, with each prediction over a threshold considered positive (i.e. ensemble of binary classifiers) |
This pre-built workflow is work in progress; however, you can refer to the workflow implementation for binary and multiclass types from the examples below:
-
Example: Binary Classification
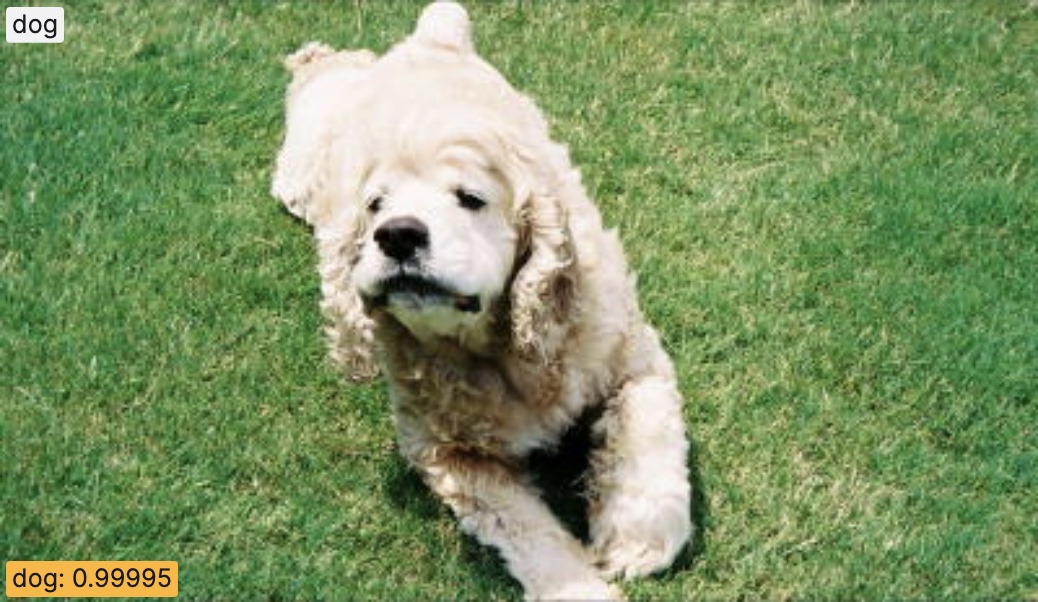
Binary Classification of class "Dog" using the Dogs vs. Cats dataset
-
Example: Multiclass Classification
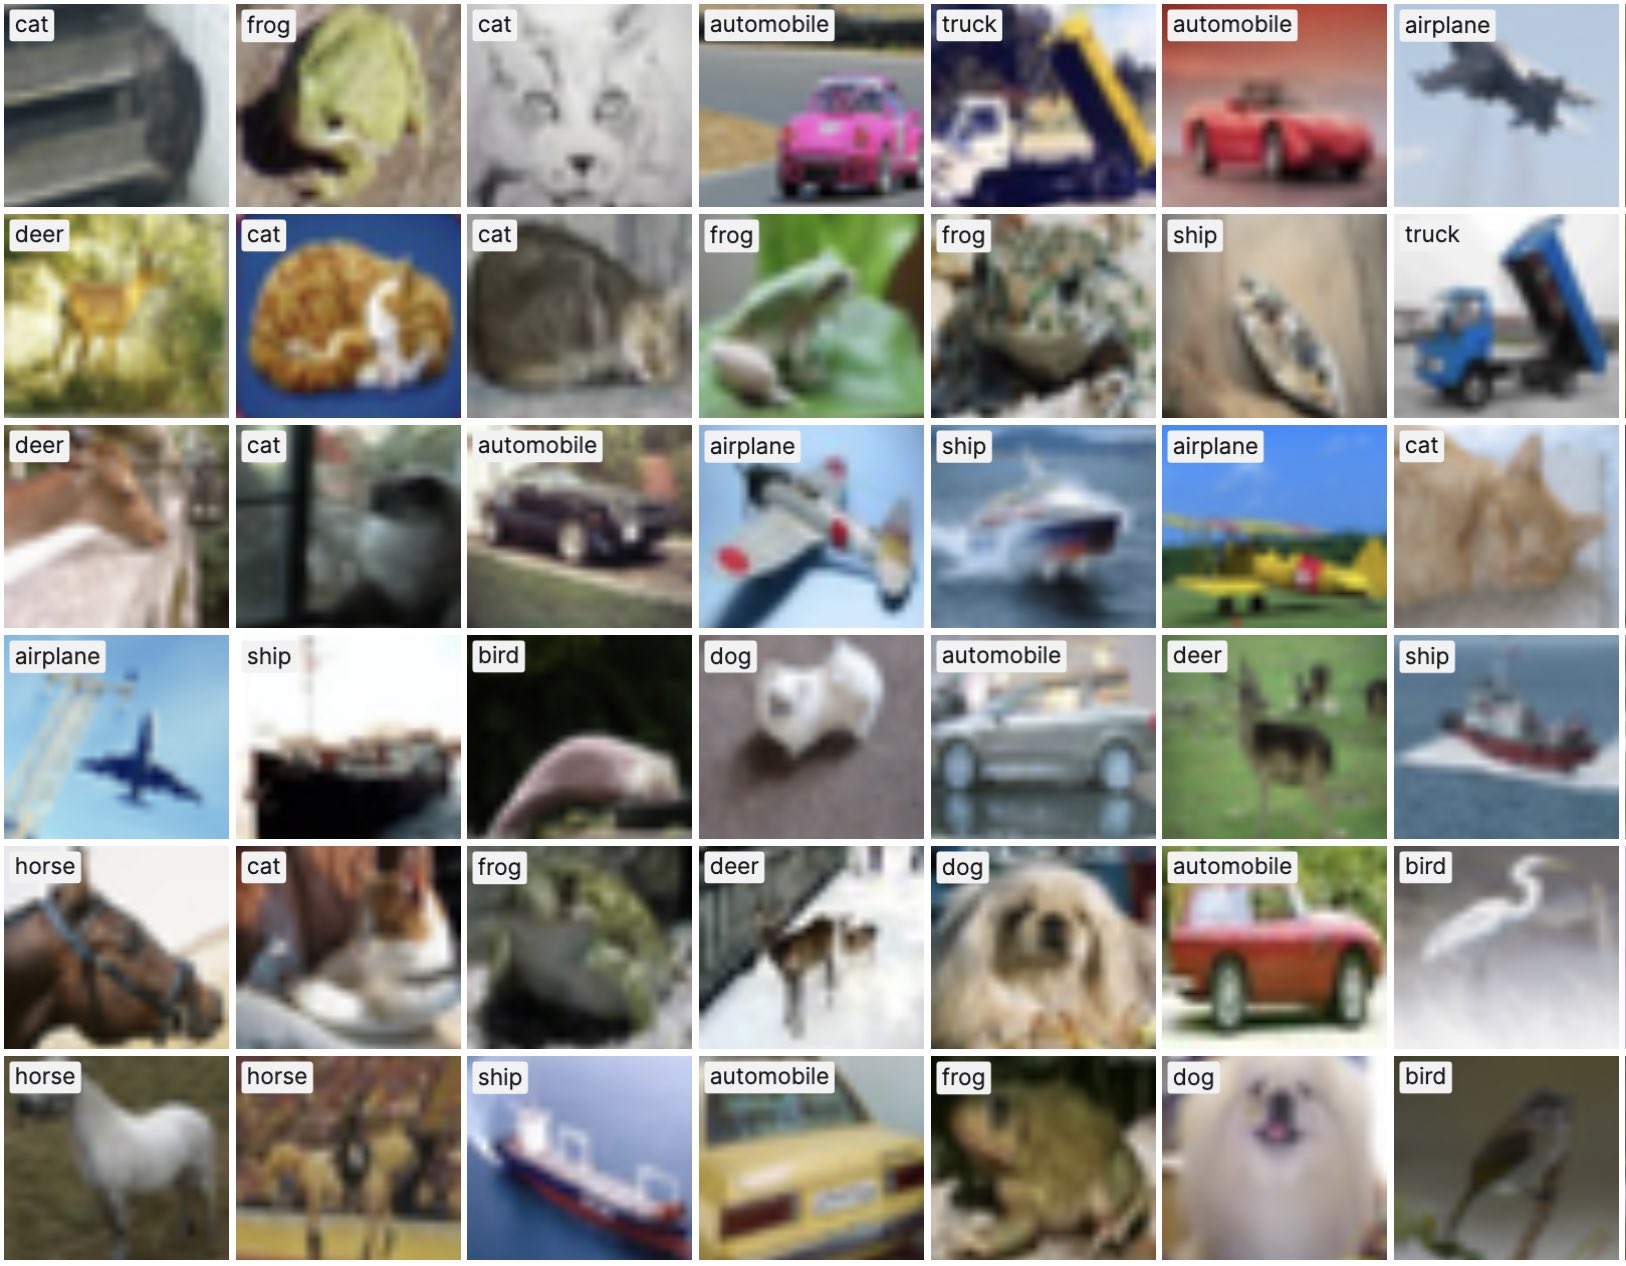
Multiclass Classification using the CIFAR-10 dataset
Utility Methods#
compute_confusion_matrix(ground_truths, inferences, title='Confusion Matrix', labels=None)
#
Computes confusion matrix given a list of ground truth and inference labels.
For a binary classification case, a 2x2 confusion matrix with the count of TP, FP, FN, and TP is computed.
Parameters:
| Name | Type | Description | Default |
|---|---|---|---|
ground_truths
|
List[str]
|
The ground truth labels. |
required |
inferences
|
List[str]
|
The inference labels. |
required |
title
|
str
|
The title of confusion matrix. |
'Confusion Matrix'
|
labels
|
Optional[List[str]]
|
The list of labels to index the matrix. This may be used to reorder or select a subset of labels. By default, labels that appear at least once in |
None
|
Returns:
| Type | Description |
|---|---|
Optional[ConfusionMatrix]
|
The |
compute_roc_curves(ground_truths, inferences, labels=None, title=None)
#
Computes OvR (one-vs-rest) ROC (receiver operating characteristic) curves for each class appears in ground_truths
if not specified.
Parameters:
| Name | Type | Description | Default |
|---|---|---|---|
ground_truths
|
List[Optional[Label]]
|
The list of ground truth |
required |
inferences
|
List[List[ScoredLabel]]
|
The list of inference |
required |
labels
|
Optional[List[str]]
|
The labels to plot. If not specified, classes appear in |
None
|
title
|
Optional[str]
|
The title of the plot. |
None
|
Returns:
| Type | Description |
|---|---|
Optional[CurvePlot]
|
A |
compute_threshold_curves(ground_truths, inferences, thresholds=None)
#
Computes scores (i.e. Precision, Recall
and F1-score) vs. threshold curves for a single class presented in
inferences.
Expects ground_truths and inferences correspond to the same sample for the same given index.
Parameters:
| Name | Type | Description | Default |
|---|---|---|---|
ground_truths
|
List[Optional[Label]]
|
The list of ground truth |
required |
inferences
|
List[ScoredLabel]
|
The list of inference |
required |
thresholds
|
Optional[List[float]]
|
The list of thresholds to plot with. If not specified, all the unique confidence scores are used as thresholds, including evenly spaced thresholds from 0 to 1 with 0.1 step. |
None
|
Returns:
| Type | Description |
|---|---|
Optional[List[Curve]]
|
A list of |
create_histogram(values, range, title='', x_label='', y_label='')
#
Creates a Histogram for the specified range and the number of bins.
Parameters:
| Name | Type | Description | Default |
|---|---|---|---|
values
|
List[float]
|
The list of confidence scores to plot. |
required |
range
|
Tuple[float, float, int]
|
The min, max and # of bins of the histogram. |
required |
title
|
str
|
The title of the plot. |
''
|
x_label
|
str
|
The label on the x-axis. |
''
|
y_label
|
str
|
The label on the y-axis. |
''
|
Returns:
| Type | Description |
|---|---|
Histogram
|
The |
get_histogram_range(values)
#
Computes an ideal range for a confidence score histograms given a list of confidence scores.
Parameters:
| Name | Type | Description | Default |
|---|---|---|---|
values
|
List[float]
|
The list of confidence scores, [0, 1]. |
required |
Returns:
| Type | Description |
|---|---|
Optional[Tuple[float, float, int]]
|
A tuple of min, max and # of bins for a confidence score histograms. The range is rounded up/down to the nearest 0.02. The bin size is 0.02. |
get_label_confidence(label, inference_labels)
#
Returns the confidence score of the specified label from a list of confidence scores for each label.
Parameters:
| Name | Type | Description | Default |
|---|---|---|---|
label
|
str
|
The label whose confidence score to return. |
required |
inference_labels
|
List[ScoredLabel]
|
The list of confidence scores for each label. For |
required |
Returns:
| Type | Description |
|---|---|
float
|
The confidence score of the specified |